The 4 Agile Metrics That Matter to Your CEO (and 3 That Don't)
Stop reporting "Velocity" and "Story Points" to the C-Suite. Executives do not care about how many points you completed; they care about business health, speed to market, and customer happiness.
When you show a CEO a burndown chart, their eyes glaze over. When you show them how you reduced "Time to Market" by 20%, they lean in. Here is the definitive guide on what to show and what to hide to prove the ROI of your Agile transformation.
The 4 Metrics to Show (The Executive Dashboard)
Definition: How long does it take from "We started working" to "The customer has it"?
This is the ultimate measure of your engineering pipeline's speed. It includes coding, testing, waiting for code review, and deployment. Lower cycle time means you can react to market changes faster.
Definition: Are users actually happy with what we shipped?
High velocity means nothing if you are shipping features nobody likes (the "Feature Factory" trap). Net Promoter Score (NPS) or Customer Satisfaction (CSAT) scores tie your engineering output to actual market outcomes.
Definition: How much time is work waiting in queues vs. being worked on?
This highlights bottlenecks. In many organizations, a ticket spends 2 days being coded but 8 days waiting for approval or QA. Focusing on Flow Efficiency forces the organization to kill bureaucracy.
Definition: Did we move the needle on revenue, retention, or acquisition?
Link every Epic or Feature to a quarterly business goal (OKR). At the end of the quarter, report on the goal progress, not the Jira ticket count.
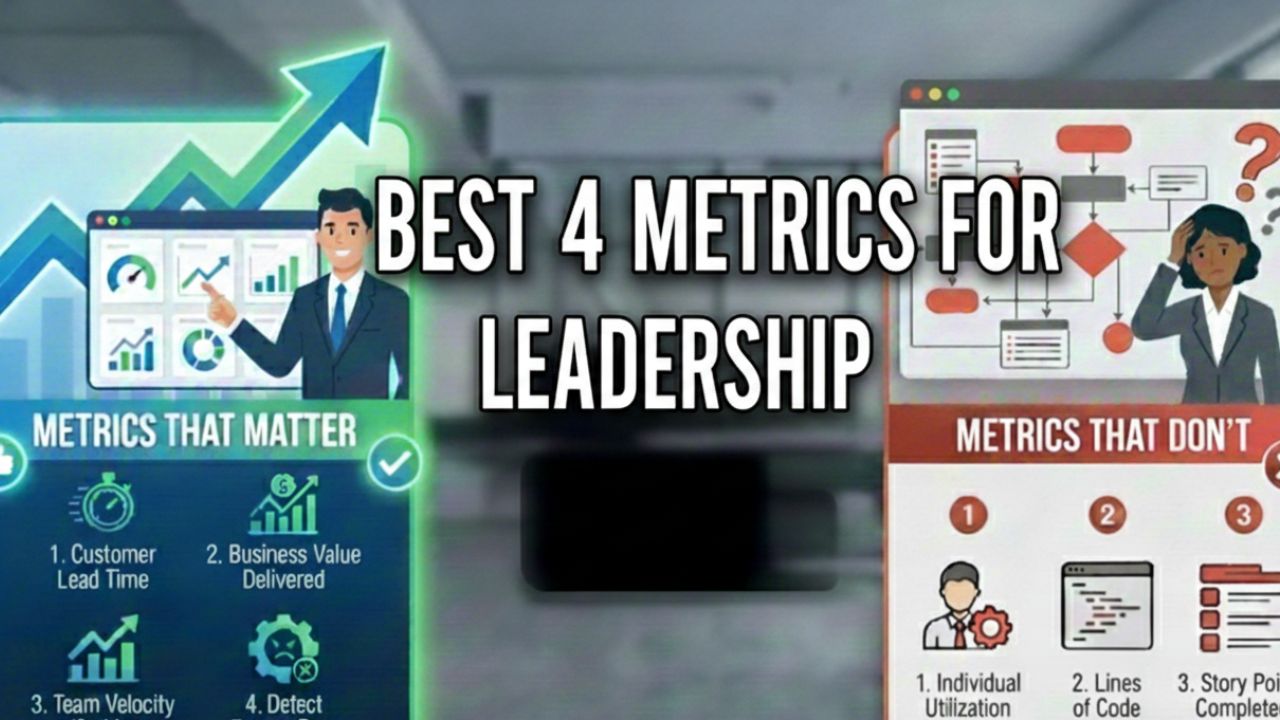
The 3 Metrics to Hide (The Vanity Trap)

Frequently Asked Questions (FAQ)
A: Velocity is a relative metric unique to each team's estimation baseline. Executives often try to compare velocity between teams (which is impossible) or turn it into a performance target, leading teams to inflate their estimates ("Story Point Inflation") to look good.
A: Flow Efficiency is calculated as: (Active Work Time / Total Cycle Time) * 100. It reveals how much time work sits idle in queues (waiting for approval, testing, or deployment). Most teams have a flow efficiency of only 15%, meaning work waits 85% of the time.
A: Push back gently by explaining that software is a team sport. High individual utilization often creates traffic jams (bottlenecks). Suggest measuring "Team Throughput" or "Cycle Time" instead, which reflects the system's ability to deliver value.
Sources & References
- DORA Metrics (Google Cloud): The industry standard for measuring software delivery performance (Deployment Frequency, Lead Time, Change Failure Rate, MTTR).
- Mik Kersten, Project to Product: Key resources on Flow Framework and measuring Flow Efficiency.
- Scrum.org: "Why Velocity is Not a Metric" - Articles explaining the pitfalls of using velocity for performance management.