Why Your AI Coding Assistant ROI Benchmarks Fail CFOs
Key Takeaways:
- The Productivity Paradox: While developers report finishing tasks faster, scaling AI usage without proper oversight can decrease overall delivery stability.
- Vanity Metrics Exposed: Measuring lines of code or raw PR volume is highly misleading; AI drastically increases PR count without necessarily accelerating actual deployment frequency.
- The Review Bottleneck: AI generates code quickly, but this shifts the bottleneck to senior engineers who must manually review a massive influx of automated pull requests.
- Financial Reality: True AI FinOps requires measuring software delivery performance against direct license costs and remediation overhead to calculate genuine net monthly benefits.
Engineering leaders are facing a credibility crisis in the boardroom. CFOs and procurement teams are increasingly questioning or canceling enterprise AI licenses because the standard AI coding assistant ROI benchmarks presented to them are fundamentally flawed.
Telling a finance executive that your software development team is writing code "55% faster" means absolutely nothing if your overall software delivery times remain stagnant and your bug rates are climbing.
To justify these expensive toolsets, engineering directors must drastically shift their measurement strategies. This requires aligning AI adoption with modern software delivery practices, specifically within a broader agentic AI SDLC and Agile transformation framework.
When you treat AI as just an advanced autocomplete tool, you measure it like a typing tutor. However, when you treat AI as an autonomous agent integrated into your pipeline, you must measure it based on sprint velocity, defect reduction, and total cost of ownership.
This guide will break down the exact financial and engineering metrics you need to prove the value of your AI tooling to executive leadership.
The AI Productivity Paradox: Why Traditional AI Coding Assistant ROI Benchmarks Are Broken
For decades, engineering departments have struggled to accurately quantify developer productivity. The introduction of generative AI has only exacerbated this ongoing issue by artificially inflating traditional output metrics.
The Danger of "Lines of Code"
Traditional output metrics are actively dangerous in the AI era. Measuring lines of code rewards sheer verbosity instead of clean, efficient, and maintainable architecture.
Similarly, relying on raw commit counts encourages activity over meaningful business value. If an AI tool quickly generates 500 lines of boilerplate that later requires extensive manual refactoring by a senior engineer, it is creating technical debt, not financial value.
The Review Queue Crisis
The most common trap engineering teams fall into is the "Review Queue Crisis". In the first few weeks of AI adoption, individual task completion rates and pull request (PR) volumes often spike dramatically.
However, this simply shifts the bottleneck further down the pipeline. Senior engineers suddenly find themselves spending disproportionate amounts of time reviewing AI-generated PRs, causing merge times to slow down significantly.
What looked like a productivity win on the surface actually creates downstream pressure and slows down the entire agile sprint.
The Code Churn Reality
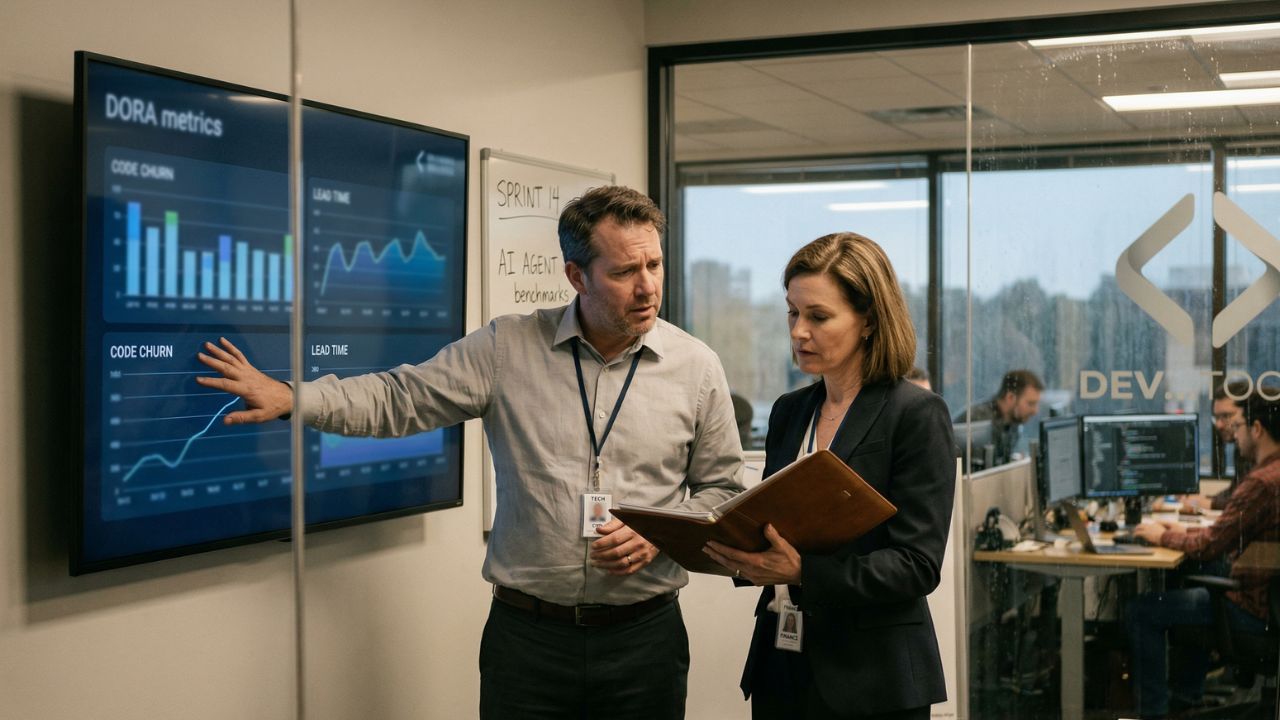
A critical AI-era metric is the AI Code Churn Rate. This measures how much AI-generated code is rewritten or deleted within 30 days of being committed.
High churn is often a leading indicator of quality debt. If developers are constantly accepting AI suggestions only to delete or rewrite them days later, you are losing valuable engineering time while paying for the privilege.
Calculating the True FinOps Cost of AI Licenses
Finance teams look at hard dollars and predictable returns. To build a compelling business case for AI coding tools, engineering managers must track the total direct costs of the platforms against quantifiable time savings and quality improvements.
Baseline License Expenses
The direct cost of equipping a development team with premium AI tools is substantial and cannot be hidden in shadow IT budgets.
For a standard 50-developer team, deploying GitHub Copilot Business costs roughly $11,400 annually, while advanced tools like Cursor's Standard tier can reach $24,000 annually. These are fixed operating expenses that must be offset by measurable revenue impact or concrete cost avoidance.
When evaluating these platforms, teams often benefit from calculating the exact cost savings against junior engineering salaries to properly contextualize the investment.
Factoring in Remediation Overhead
A critical financial factor entirely missing from standard vendor benchmarks is remediation overhead. Anecdotal industry reporting suggests a significant share of developers find that AI-generated code ultimately demands some level of refactoring.
If your team saves 100 hours a month generating code, but spends 20 hours fixing subtle logic bugs introduced by the AI's confident hallucinations, your net time savings are drastically reduced.
Accurate ROI calculations must subtract this remediation time to find the true net monthly benefit.
The 40-20-40 Rule of Engineering Value
One of the most useful diagnostic heuristics we use for sustainable engineering ROI is what we call the 40-20-40 rule—our own rule of thumb, not an external benchmark. As a starting point, teams often spend roughly 40% of their time on new feature work, 20% on rework, and 40% on maintenance and operational tasks.
The financial ROI of AI is proven when these ratios shift. If AI can automate routine testing and documentation to shrink the maintenance bucket, while producing higher quality drafts that reduce the rework bucket, developers can dedicate significantly more time to revenue-generating feature work.
Using DORA and SPACE Metrics to Prove Enterprise Value
The most reliable way to prove the financial value of AI tools to a CFO is to rely on established, industry-standard delivery frameworks. DORA metrics remain the absolute gold standard for measuring true engineering performance.
Deployment Frequency and Lead Time
These two DORA metrics strictly track engineering throughput. Deployment Frequency measures how often your codebase safely reaches production, while Lead Time for Changes tracks the time from the initial code commit to a successful deployment.
If your AI tools are truly working, you should see lead times decrease as features move faster. However, if PR volume rises but lead time remains completely flat, you have clearly identified a severe review bottleneck that is killing your ROI.
Change Failure Rate and MTTR
These metrics track the stability of your software architecture. Change Failure Rate measures the percentage of deployments that cause production issues, while Mean Time to Recovery (MTTR) measures how fast you fix those breaks.
If your team increases AI adoption but simultaneously sees a spike in the change failure rate, the AI is likely introducing subtle bugs or security vulnerabilities that are bypassing your quality gates.
Tracking these outcomes prevents organizations from recklessly prioritizing speed over system stability.
The SPACE Framework for Context
While DORA metrics tell you how the delivery system performs, they lack context about the human element. This is where the SPACE framework is necessary.
SPACE evaluates Satisfaction, Performance, Activity, Communication, and Efficiency. By surveying developer satisfaction alongside DORA data, you can prove that AI tools are not just speeding up deployments, but actively preventing developer burnout and improving retention rates.
Conclusion & Next Steps
If you want to secure and expand the budget for advanced developer tools next quarter, you must abandon outdated, output-based vanity metrics. CFOs and financial stakeholders are not impressed by how many thousands of lines of boilerplate an LLM generated;
they care deeply about feature velocity, system stability, and predictable financial returns. By implementing strict AI coding assistant ROI benchmarks rooted in DORA metrics, the SPACE framework, and highly accurate cost modeling, you can definitively prove the undeniable value of your engineering stack.
Stop guessing at your team's productivity and start treating AI adoption as a rigorously measured FinOps initiative. Would you like me to outline a custom data collection strategy to establish your team's baseline DORA metrics before your next AI tool rollout?
Frequently Asked Questions (FAQ)
Standard benchmarks track direct financial metrics against developer performance. Instead of measuring lines of code, elite teams measure the net monthly financial benefit by calculating developer time saved, minus the tool license costs and the time spent on AI code remediation.
Productivity should be measured using system-level frameworks like DORA metrics (Deployment Frequency, Lead Time for Changes) paired with the SPACE framework. This combination ensures you are measuring actual software delivery speed and developer satisfaction, rather than just raw code output.
The true cost extends beyond the sticker price. For a 50-person team, Copilot Business costs $11,400 annually. However, the total cost of ownership must also include the onboarding time, administrative overhead, and the critical time senior developers spend reviewing AI-generated pull requests.
It depends heavily on the implementation. While AI can quickly generate unit tests and identify simple syntax errors, scaling AI adoption without proper code review guardrails can meaningfully decrease overall delivery stability.
Managers must track AI-specific leading indicators alongside DORA metrics. Critical tracking points include the AI Code Churn Rate (how much AI code is rewritten within 30 days), the PR Review Load per Senior Engineer, and the AI Suggestion Acceptance Rate over time.